Virta’s 2021 total carbon footprint was 11,346 tCO2e (market-based). The majority (99.9%) of Virta’s climate impact is from indirect emissions originating from the value chain (scope 3), with Virta’s own operations (scopes 1 & 2) generating limited climate impact.
Virta’s first carbon footprint assessment, calculated with support from UseLess Oy, was done using the internationally approved GreenHouse Gas Protocol (GHG) Corporate Standard. From Virta’s total carbon footprint of 11,346 tCO2e, scope 1 and 2 emissions were 8.7 tCO2e and scope 3 emissions were 11,337 tCO2e.
“We are striving to realise sustainable and tangible disruptions in energy and mobility at a global scale. The sustainability impact assessment is a crucial measure of our joint success. We mean to scale this further in cooperation with our customers, and it will make a real difference—not only by replacing oil, but by enabling renewable energy on a scale never seen before after the invention of the steam engine,” says Jussi Palola, CEO and Co-Founder of Virta.
To put Virta’s carbon footprint in perspective, total emissions per person from consumption in Finland during 2019 was 10.3 tCO2e, and the average carbon footprint of Finns has varied from 9.9 tonnes to 13.5 tonnes a year since 2000.
While Virta’s corporate carbon footprint can be seen as the “cost” of business operations to the climate, the company’s purpose is to help others lower their carbon footprint, and thus can be seen to offset emissions elsewhere.
“For us, it is crucial to know where we stand in terms of sustainability so that we know how to best move forward. As can be seen in our results, we are already on a good path, but there is always work to be done and we will only improve from here,” says Antonia Åkerberg, Sustainability Manager at Virta.
97% of Virta's carbon footprint results from the use of sold products
All of Virta’s scope 1 emissions are from the combustion of fuel in hybrid cars leased by Virta, and scope 2 emissions originate from electricity (18%) and heat production (82%).
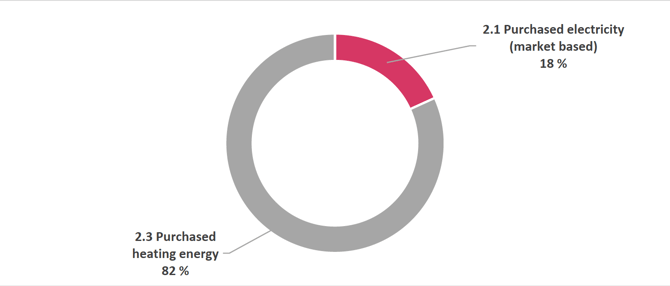
Graph 1: Scope 2 emissions by category.
Nearly all (97%) of Virta’s downstream scope 3 emissions are from the use of sold products, which refers to emissions from the production of energy that consumers charge from Virta stations. From upstream scope 3 emissions, the main contributors are purchased goods and services and business travel, as seen in the graph below.
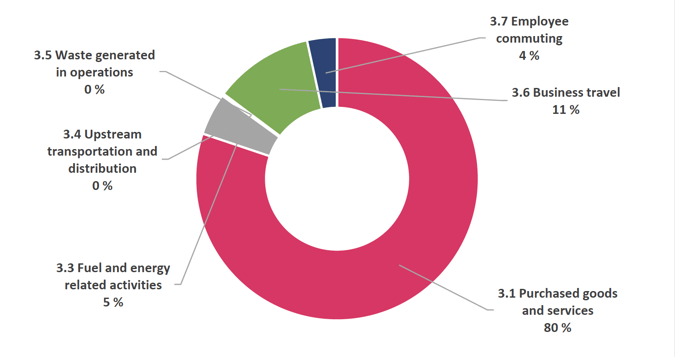 Graph 2: Results of upstream scope 3 emissions.
Virta’s wide use of e-vehicles can also be seen from the assessment: the carbon footprint resulting from employee commuting is lower than the average footprint of companies with similar commuting habits.
The reporting period for Virta’s carbon footprint is from January 1, 2021 to December 31, 2021. The organizations included in the study are the parent company Liikennevirta Oy (Finland) and subsidiaries Virta International GmbH (Germany), Virta Nordic AB (Sweden), Virta SARL (France), and Virta Ltd (UK).
Contacts and enquiries:
Antonia Åkerberg, Sustainability Manager at Virta
Virta receives Frost & Sullivan Technology Innovation Award
/woman-sitting-electric-car-wind-turbines-sunset.webp?width=1920&height=1080&name=woman-sitting-electric-car-wind-turbines-sunset.webp)
Virta publishes its first ever sustainability report
Virta EV Energy Insights vol.1
/FREY/frey-cable-being-plugged-into-ensto-charger.webp?width=1920&height=1080&name=frey-cable-being-plugged-into-ensto-charger.webp)